This post was prompted partly by the recent collapse of the Fern Hollow Bridge in Pittsburgh, but I’ve been looking at material stats related to bridges for a while now. While as an engineer, steel was my favorite material to design with, I’ve been surprised by some of the statistics related to steel bridges in the U.S. and wonder what the future holds for this material within our infrastructure.
General Information
Based on the 2021 data set for the National Bridge Inventory, steel is one of the most common structural materials for vehicular bridges. Of the 574,372 bridges1 in the data set, 208,422 (36%) are categorized as steel bridges, 144,321 are reinforced concrete, and 203,041 are prestressed concrete.
Figure 1. Steel bridges in the U.S. (Note the concentration in the eastern half of the country)
The most common types of steel bridges are box beam or girder bridges, which you are likely familiar with as your typical highway overpass (93%), followed by truss bridges (5%), with moveable bridges and arch bridges being a distant third and fourth. See here for an overview of the distinctive bridge types.
Figure 2. Distribution of Steel Bridge Types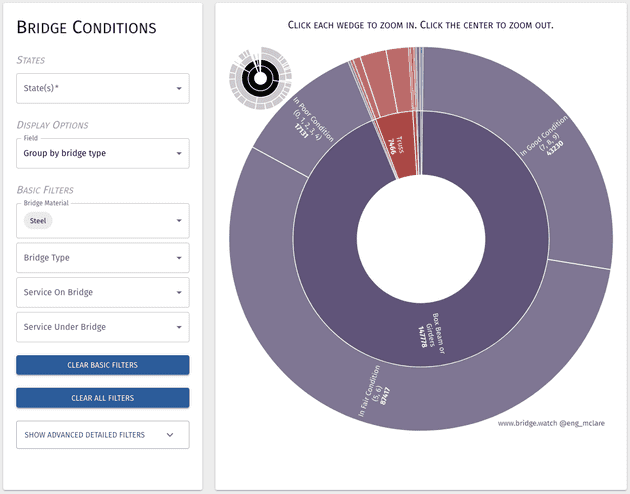
Steel suspension bridges, like the iconic Golden Gate Bridge, are quite a rare typology that are reserved mainly for long spans (two thirds have a span of 500 feet or longer). Steel truss bridges and arch bridges can also be used for spans over 500 feet.
The National Bridge Inventory uses a single material code to classify bridges, which can be confusing for bridges which utilize multiple materials for critical components, like stayed girder (a.k.a. cable-stayed) bridges. Of the 106 stayed girder bridges (a typology which utilizes steel for the cables, concrete for the superstructure, and steel and/or concrete for the tower), 65% are categorized as steel bridges, with the rest either reinforced or post-tensioned concrete. The National Bridge Inventory does not provide guidance on how the material distinction is determined in cases where multiple materials are used.
Interesting Statistics
Steel bridges are some of the most heavily trafficked in the U.S. For the 34,172 bridges that have over 50,000 cars traveling on them per day, nearly half of them are steel bridges.
Figure 3. Steel bridges with heavy traffic in the U.S.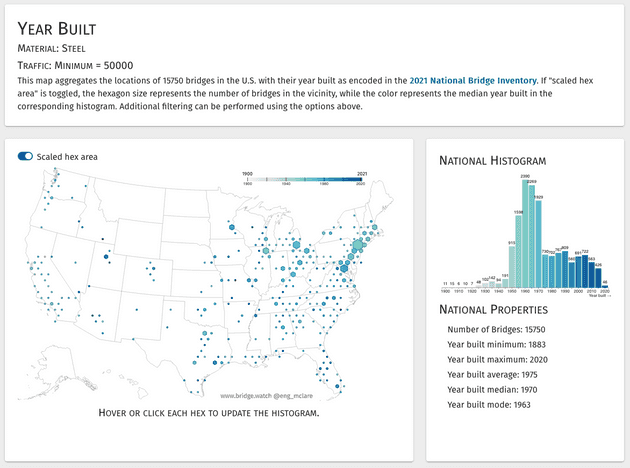
Among all long span bridges in the U.S. (902 over 500 ft long), 87% of those bridges are steel bridges (with only 6% of the long span “steel” bridges being stayed girder, where a “steel” material classification is debatable). Among the long-span bridges that have been given ratings in the NBI, nearly 50% are truss bridges. These long-span steel bridges largely follow the Mississippi River System. The Mississippi River is over 4,000 feet wide in several places, such as the location of the Grand Tower Pipeline Suspension Bridge between Illinois and Missouri. Long-span steel truss bridges are on average about 10 years older (avg year built 1957) than other steel long-span bridges (avg year built 1968), and over 40 years older than all other types of long-span bridges (avg year built 1999).
Figure 4. Steel Truss Bridges over 500 ft long in the U.S.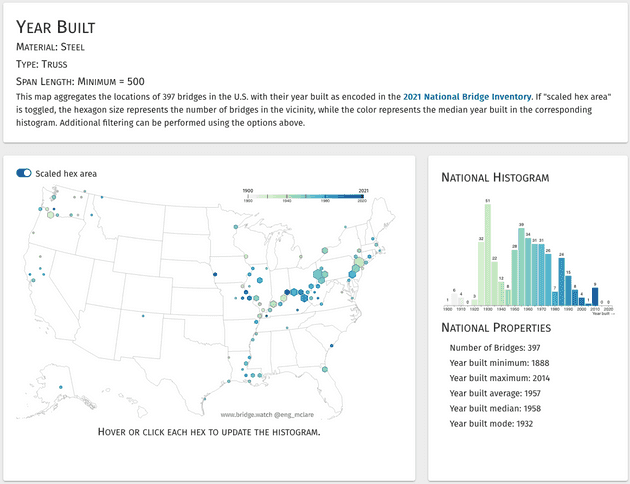
Given that steel long-span bridges are on average 40 years older than other long-span bridge types, it should not be a surprise that they are in worse shape. 13% of long span steel bridges are in poor or worse condition according to the NBI rating system based on the deck, superstructure, and substructure, whereas only 6.6% of other long-span bridges have a rating of poor or worse.
When looking at all steel bridges, they have the highest proportion of poor ratings (13%) compared to reinforced concrete (7.8%) and prestressed concrete (3%).
The Fern Hollow Bridge and Others Like It
The Fern Hollow Bridge is a bit unusual in its classification as a steel continuous “frame” bridge. There are only 446 steel frame bridges in the entire U.S., with most of them in the eastern half of the country. In terms of “poor” ratings, these bridges have the same percentage (8.5%) as bridges of all materials and types throughout the U.S.
Figure 5. Steel Frame Bridge Conditions in the U.S.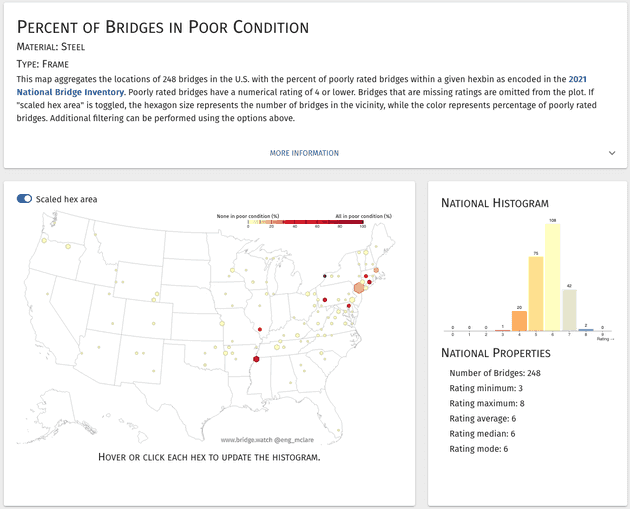
A fair amount of press has been focused on the general condition of bridges in Pennsylvania. One of the most interesting things about bridges in the Northeast is that they have a significantly higher proportion of steel bridges than states in the West. This is partly due to infrastructure in the west being newer, but there are also other forces at play (such as the prevalence of significant steel mills both in Pennsylvania previously as well as across the border in Canada).
Figure 6. Northeastern states bridge material choice (left) and Western states bridge material choice (right)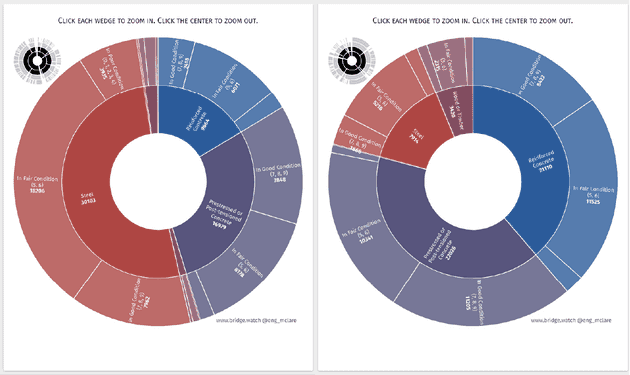
Within Pennsylvania, 22% of steel bridges are in poor condition, compared to 13% for steel bridges in the entire country, and compared to 12% for other bridge types in Pennsylvania.
Figure 6. Steel Bridge Conditions in Pennsylvania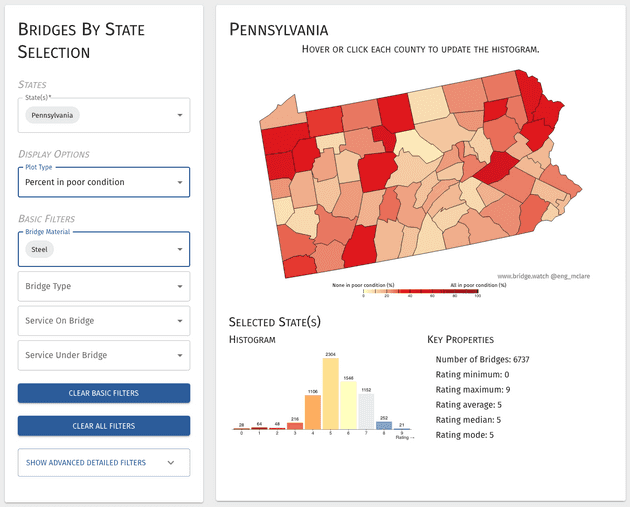
Across the U.S., steel frame bridges compared to all other steel bridge types of steel bridges fare better in terms of percent poor (8.4% vs 13%). Still, very few steel frame bridges have been built in the past 20 years (most were built in the 1960s and 1970s; Fern Hollow was built in 1970). However, in general, the construction of steel bridges hit its peak in the 1960s and 1970s, while prestressed concrete has become the most popular bridge material in recent decades (50% of all bridges built after 1970 are prestressed).
In Pennsylvania, the average age of a steel bridge is a little over 60, while the rest of its bridge infrastructure averages 50 years old. Pennsylvania’s worst infrastructure was built on average in 1939.
Figure 8. Year Built for Pennsylvania Steel Bridges
Fern Hollow had a daily estimated traffic load of 14500 vehicles (though this number was pretty outdated from 2005). Within Pennsylvania, there are 4430 bridges with a similar level of traffic or higher, and 7% of those bridges are rated as being in poor condition. When you look only at steel bridges at those traffic loads, it’s only slightly higher with 8% being in poor condition. So while steel bridges are worse off in Pennsylvania compared to national statistics (again, 22% vs 13%), for heavy traffic loads, the number of steel bridges in poor condition is quite a bit less. For similar or greater traffic loads, only 6% of steel bridges are in poor condition nationally.
Figure 9. High Traffic Poorly Rated Steel Bridges in Pennsylvania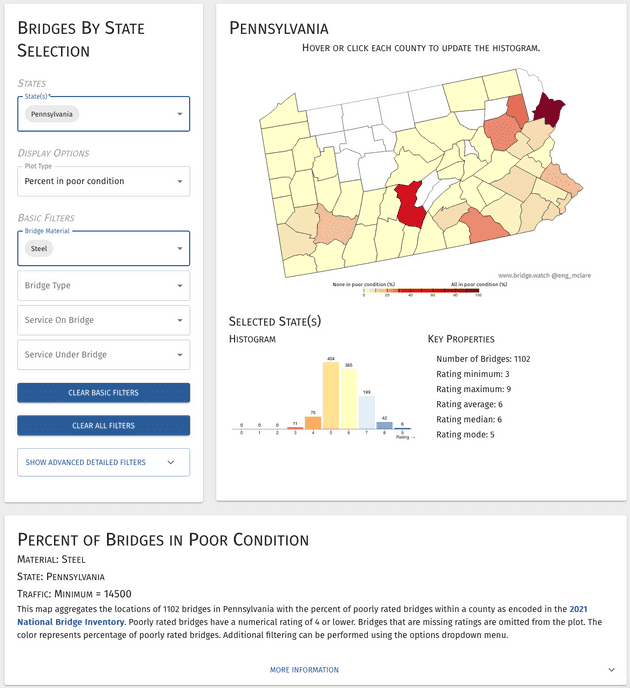
With this, I’ve really only scratched the surface of information about steel bridges in the U.S. If you’re interested in more about the Fern Hollow bridge and infrastructure conditions in the U.S. in general, I recommend the following links.
-
Bridge.watch Every graphic on this page was generated using Bridge.watch to create aggregate visualizations of subsets of the NBI data.
-
Pennsylvania DOT has a handy interactive map where you can look at each bridge.
-
Specific raw data for just the Fern Hollow Bridge is available through the FHWA’s InfoBridge website (click the NBI or NBE tabs for more detailed information)
-
The FHWA’s InfoBridge website allows for tracing specific bridge information over time, something Bridge.watch can’t do (yet!) since I’ve only been working with the 2021 dataset.
-
The National Transportation Safety Board (NTSB) has issued a preliminary report on what happened to the Fern Hollow Bridge.
- The national data numbers provided throughout are based on the bridges in the U.S. that had latitudes and longitudes assigned to them in the NBI dataset. The actual values may be slightly different in reality, as 0.3% of bridges in the database had state and county information, but lacked latitudes and longitudes.↩
 Support this project