I recently came across this article outlining some of the challenges of having an influx of funding for infrastructure, when the last major bill was passed in 2012 (and the one before that was in 2005). Not surprisingly, it’s not enough to just throw money at a problem when about half of the funds will be dispersed on a competitive basis. At this point, many smaller cities lack the workforce to be able to prepare competitive bids, and the Reuter’s article focuses on Erie County in Pennsylvania as an example. I decided to use Bridge.watch to get an idea of how the bridge infrastructure is doing in that county compared to the rest of Pennsylvania and the country.
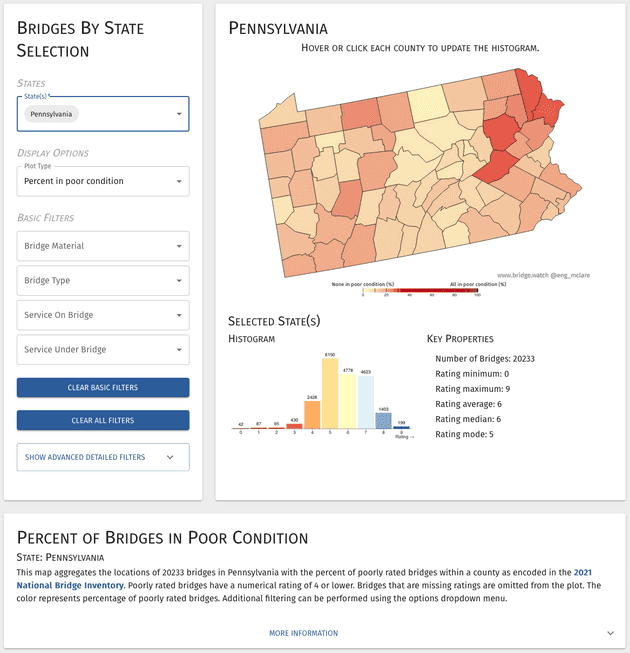
Erie County has fewer poorly rated bridges (11%), compared to counties in the eastern part of Pennsylvania (there are several at about 30%), and it has a similar total of bridges compared to other Pennsylvania counties at 368.
Figure 1. Poorly rated bridges in Pennsylvania
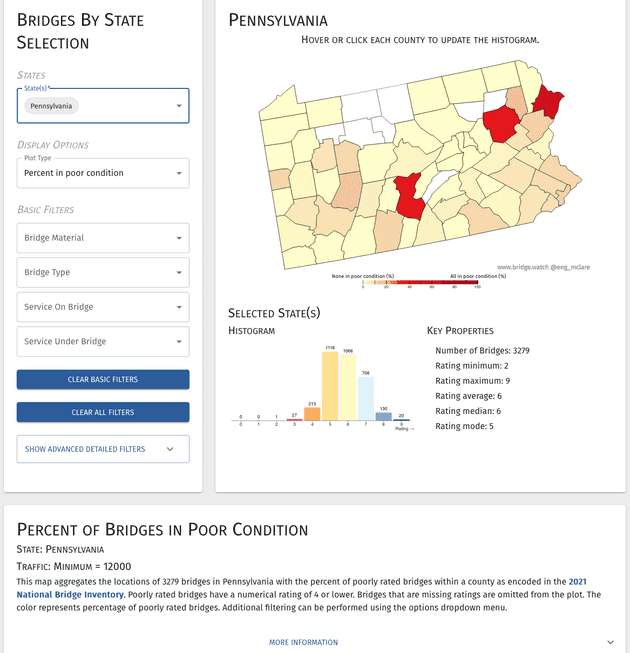
If you filter further by average daily traffic, for the median daily traffic across the U.S. (~1700 vehicles/day), this value of poorly rated bridges drops to 4% for Erie, where approximately half of their bridges have that level or greater traffic per day. The average daily traffic value across the U.S. is quite a bit higher (12000 vehicles/day), and if you filter by that traffic level, there are no bridges in Erie County in poor condition that are that heavily trafficked (however, Luzurne County has a significant number of poor condition highly trafficked bridges).
Figure 2. Poorly rated bridges in PA with a traffic load of 12000 or more vehicles a day
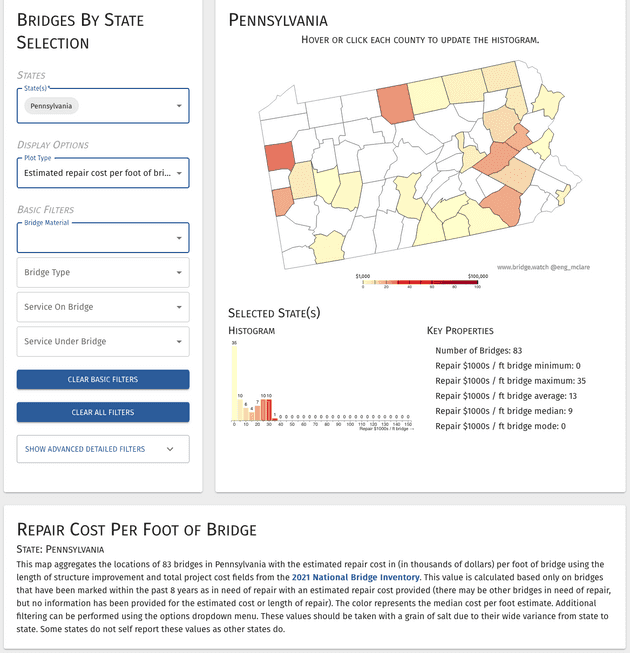
One field documented within the NBI is the estimated repair cost provided per bridge, which I included as a display option as an estimated repair cost per linear foot of bridge (based on the ratio of the repair length of the bridge and construction repair cost contained in the database). When I started looking at this metric, I realized how patchy reporting was for this, and perhaps this is also a symptom of the reduced workforce indicated in the article. Erie County has no bridge estimated repair costs, and only about 30% of Pennsylvania counties have any repair costs reported. 0.4% of bridges in PA have any repair value at all, while 15% of those bridges are rated as in poor or worse condition.
Figure 3. Pennsylvania bridge repair costs
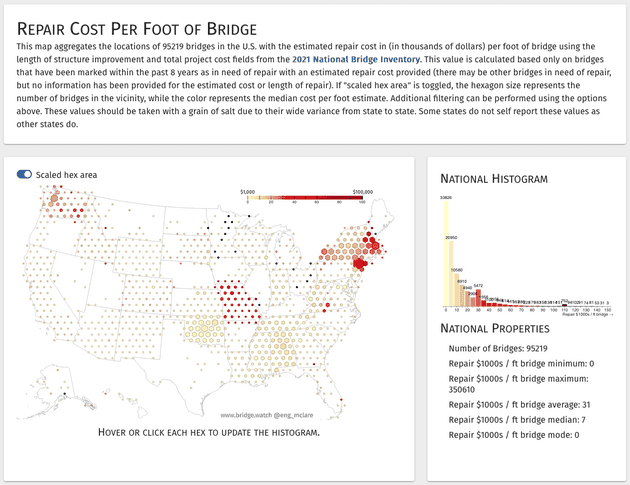
While the Pennsylvania Department of Transportation has pretty decent websites for getting aggregate information, it is all still based on the public data submitted to the NBI. I was hoping I’d be able to find more detailed expected repair costs at the state level, but unfortunately that information either does not exist, or it is not public. It will be interesting to see if states that have reported estimated repair costs to the FHWA with their NBI data (like New York and Missouri as shown below) will be more successful at attaining those infrastructure funds, because they’ve been reporting these values for awhile, and they already have the workforce in place to prepare competitive bids.
Figure 4. Estimated bridge repair costs in the U.S. as reported to the FHWA
 Support this project